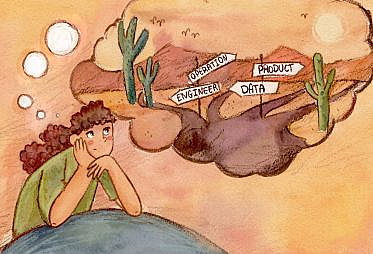
I often get asked by junior data professionals how they can improve as data scientists. Today I will outline a generic framework for thinking about learning and provide a few concrete examples in support of it. These are tools that I still employ in my day to day learning and growing as a data professional.
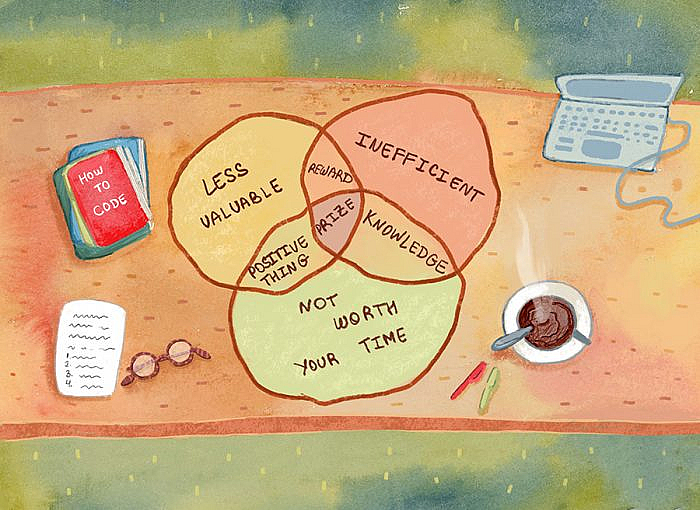
There are various sources of information on any given topic, all of which have overlapping content (like a Venn diagram). Each book you read or online course you take on a given subject will have some content in common with the rest of the field and some that is specific to that author’s perspective. When learning any given topic, you should strive to understand the most shared content first – that space of maximum overlap. Once you feel comfortable with the content in the middle, begin to move outwards to the edges.
The idea is that the density of the overlap is proportional to the value of the knowledge therein. This learning framework was alluded to by Tyler Cowen (for one) on the Ezra Klein podcast when he recommend reading piles of books instead of any individual book on a given subject: there isn’t really a single definitive, true source on anything. There are many sources of knowledge that overlap in various areas. The best bang for your buck exists in identifying and mastering that overlapping space.
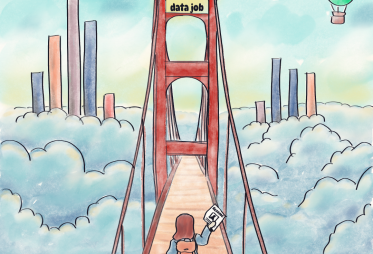
In this post I will discuss some approaches to learning skills that every Data Scientist should be familiar with:
- Python / R / coding skills1Not mentioning SQL or Excel because those are table stakes.
- Basic stats
- Business applications
Coding skills
Knowing how to code is critical to becoming a successful data scientist. From scripts for cleaning and assembling data to data visualization to model fitting and machine learning, you will have to use code for some parts of your job. Excel (and other GUI-driven applications) are great tools, but they are complementary skills, not substitutes!
Once you convince yourself that learning to code is critical, start with python2Or R but probably python if you want to work in tech. I recommend learning python from two distinct perspectives – Data Analysis and Software Engineering. Most aspiring DS’s will likely download a book about Data Analysis in Python or perhaps take online courses. Luckily there is no shortage of good content. Don’t stress much over which is the best one – remember to think in terms of piles not individual sources of knowledge. Pick one and work through the first few chapters which tend to cover basic concepts. Then download some datasets and hack on them using what you learned. Next, choose another book or course and repeat. Do this a few times and you will notice where the overlap is. Then you can start getting into the later chapters where content tends to diverge. Just make sure you have locked in the basics.
As a data scientist, you will code differently than your software engineering counterparts. It’s important that you focus on learning the skills that will help you most while avoiding going down a computer-science rabbit-hole of traditional software engineering skills. As a data scientist, I recommend focusing on:
- Scripting for getting things done on your local machine
- Loading data using
os,requestsandjson - Data and vector manipulation with
pandasandnumpy - Plotting with
matplotlibandseaborn - Basic machine learning with
sklearnandscipy
After getting the basics of data analysis-centered python programming, you can move onto something more generic like programming a game or learning basic backend development. The point isn’t to become a software engineer (don’t worry a 3 week course in python won’t get you there) but it can be useful to understand these other paradigms so you can apply some of them to your own work.
It’s also very helpful to become comfortable operating in a Unix shell – get away from windows and learn to love the command line. Start by customizing your terminal! Learn about your .bashrc and .bash_profile and customize it. Better yet, do it in Vim3Or emacs heaven help you.. This alone will elevate your Unix game quite a bit. You will need it if you are going to get comfortable with git, environment variables or .config’s (if you want to connect to a database or external server) and navigating your project directory as you load data into your python script for analysis.
Basic stats
If you will be building models and performing analysis, focus on linear regression, hypothesis testing and logistic regression first. These topics are foundational and complex enough to keep you busy for a while, especially if you don’t have a strong Statistics background.
You can learn about linear regression from a number of different perspectives:
- Traditional Statistics: think probabilistically, understand assumptions about independence, homoscedasticity, and normality
- Bayesian Inference: priors, posteriors, and credible intervals
- Machine Learning / Computer Science: solve for a set of weights that minimizes the squared error between an estimate and an observation
Once you have got a solid understanding of the various ways of formulating the same problem – prove it using data! Solve, from first principles, a LR or logistic regression problem from both a statistics or CS perspective. The best way to test your understanding is to make predictions before you run your model. Establish a hypothesis and see if your understanding and intuition line up with the results. Feel free to spend a lot of time in this phase, iterating, building and learning, before moving on to the “sexy”, advanced material.
Build some business intuition
Learn basic analytics and business intelligence methods. This includes cohort modeling, attribution and funnel analysis and how an A/B test works. Know what a marketing function does and why they (should) work closely with the Analytics team. Why should Product managers care about sample sizes? It’s not rocket science but it’s important to understand so that you can maximize the value you bring to your organization.
Also team up with the Finance function and learn how they think about the business. The leadership team ultimately cares most about the bottom line so understand how your models or business function supports the Financial model underlying the organization. It’s very clarifying once you understand what matters most to the health of the company. I won’t harp on this too much because most of it will come on the job. Don’t rush it, but keep it in mind when you are building a dashboard or querying a database at the office. It’s harder to learn this stuff on your own compared to Python basics or how Decision Trees work.
Speaking of practical business oriented advice, it will be helpful to read a lot about why humans make bad (biased) decisions. Become a student of behavioral science and popular psychology (Daniel Kahneman and Amos Tversky, Richard Thaler, Dan Ariely, Nate Silver, even Malcolm Gladwell!). People make suboptimal decisions all the time. Data science is in large part a way to help people make better decisions by creating decision frameworks. Therefore it helps to learn where they are likely to screw up. Once you read a small pile of these books, you will see a lot of overlapping themes and it will be more readily apparent where you can add value with an unbiased, dispassionate analysis.
Keep learning
Don’t optimize locally. Get many perspectives (including on my advice!). Talk to many people in the industry. Go to Meetups, networking events and build your brain trust. Learn the vocabulary and start using it. Don’t worry about being as efficient as possible in every endeavor all the time – you will be working and learning for many years to come. Of course, it is helpful to learn when you have wasted your time. It will happen so don’t fret over it – instead use it as a learning experience. When you feel yourself veering away from the high density area of the Venn diagram, check if you are confident in your knowledge of the overlap and take small, incremental steps outwards.
- 1Not mentioning SQL or Excel because those are table stakes.
- 2Or R but probably python if you want to work in tech
- 3Or emacs heaven help you.