Congratulations, you are launching an analytics/data function! Maybe you are the first analytics hire at a brand new company, or perhaps you are bringing analytics to a mature company that historically lacked a comprehensive data strategy. You sold the vision and also put together a roadmap based on your experience and current best practices. What could go wrong (and who could argue that refactoring from a star to snowflake schema is an important company-wide goal)?
The reality is that, like any other function, analytics and data exist within the context of an organization – an organization that has competing priorities, politics, and limited resourcing. I wrote this article to help you combine pragmatism with best practices and prepare for the discussions with engineering, finance, and possibly the senior leadership team.
Over the past 5 years, analytics technology has coalesced around three components: a data-moving tool (possibly referred by EL, extract-load, or ETL, extract-transform-load), a data warehouse to store aforementioned data, and a BI layer to analyze the data. You may also want to consider implementing a business logic layer, which I touch on at the end of the article.
I am going to sort the article by tool, since that is how you are making discrete decisions. But when talking to the org, you need to do the opposite! It is time to put on your salesperson hat, in two specific ways:
- You are not buying tools – You are solving problems! Create your “elevator pitch”, framed in terms of the benefits – faster results because X, Y more revenue because Z – and not in terms of “this tool is more expensive, but you can visualize as a directed acyclic graph!”. If two tools are most easily explained as solving a single problem, pitch them that way, and combine the cost estimates. Put simply, no one cares if the flapper, float cup and flush valve cost $3, \$5, and \$8. They want a working toilet and are willing to pay \$20.
- You need to understand who in leadership has decision-making power and engage them early to understand the steps towards approval. Otherwise, you can waste a lot of time trotting out presentations to anyone willing to listen.
EL Tool:
- Some solutions you might consider: Stitch, Fivetran, tray.io
The data-moving component will transport data from your source (e.g. production database) to a destination where you can easily analyze it. You main consideration is to ensure your tool of choice will support any data sources you will need over the next several years. It is worth opting for a tool that covers software you are planning on using next year to avoid the switching cost down the road, and this is easy to explain.
For finance, most data-movers costs far less than a full-time Data Engineer, so buying this component saves the company money from paying an engineer to do (unsatisfying) data work. However, some providers bill per number of rows synced, while some bill per number of unique data sources. You may find that the finance team prefers the billing structure of your second choice much more than your first choice provider. Be prepared to either convince finance that you can keep variable costs under control, or convince the sales rep to customize your contract.
From the engineering side, you may get “Don’t waste money – we could do this ourselves, it is so easy”. Be prepared to ask if any of your well-intentioned teammates:
- Have actually implemented and maintained a data pipeline for several years
- Are personally volunteering to do so, for you, in a timely manner
- Are excited to be on-call 24⁄7 to fix issues
Analytics Database:
- Some solutions you might consider: Postgres, Redshift, Snowflake, Google Cloud
There are more posts comparing analytics databases than there are rows in my database, so I will spare details and instead discuss a useful framework for choosing open-source vs. paid. It is tempting to spin up a open-source database and use it for analytics, but you should carefully evaluate if the benefit of cost savings is worth the switching costs you will incur later.
In my case, I balked at the price of Snowflake and tried to use a Postgres instance for analytics because we had a small amount of data. In hindsight, this was a poor decision, because the savings of (Snowflake – Postgres) * (time before we needed to switch to Snowflake) is less than the cost of spending time trying to diagnose random Postgres issues once a week. Don’t undervalue your own time!
For finance, again, different providers have different billing structures and you may not realize how much of a sticking point this can be. Additionally, your company may want to stick with the default analytics DB of the cloud provider you are already using. However, unlike data moving, there are substantial feature differences between paid options. You should be prepared to advocate for your preferred solution by articulating the value add, in terms of faster project throughput and/or less human intervention costs.
Business Intelligence & Visualization:
- Some solutions you might consider: AWS Quicksight, Periscope (now Sisense), Mode, Looker, Holistic, Metabase (Free), Superset (Free)
Even though the BI purchase is expensive, it’s often the least contentious since it is the only technology of the three that business people actually see! Build a value proposition by combining expected maintenance costs (in salary/opportunity cost) with the value of avoiding a bad decision due to bad data ($10K?). By my simple back of the envelope calculations, Looker ended up being cheaper than (free) Superset, because it largely runs itself and enables self-serve data exploration.
This is one of the purchase decisions that may actually merit a deck or formal document outlining the pros and cons of each option. However, I regret over-democratizing the process by involving multiple business users to help make the decision by committee. At the end of the day, making simple dashboards is similar in each system, and it is you, not business users, who will bear the burden of maintaining permissions, fielding questions, and ensuring data accuracy. Reach out to the greater data community and hold yourself accountable to make the right decision.
I made one specific mistake here that I want to share: Looker was much more expensive than the other options, and, to explain the cost, I leaned on the value proposition of teams not needing to hire an analyst to write SQL queries. This was a mistake for two reasons:
- Business users still need a baseline skill level to use Looker. A surprisingly effective rule-of-thumb is that if a person is comfortable with pivot tables in Excel, they can do Looker. Do a quick calculation of how many people in your org need data, and of those, how many of them you would trust to make a pivot table.
- There are benefits to hiring an analyst beyond simply doing SQL queries. Looker saved us from hiring an analyst to do simple SQL queries, but led to more complex follow-up questions, so there was still a lot of work. Also, another analyst could also have added value by connecting the dots of cross-functional business requests into product priorities. Unless you are severely budget constrained, it doesn’t hurt to have another bright technical person around, and the earlier you hire them, the better.
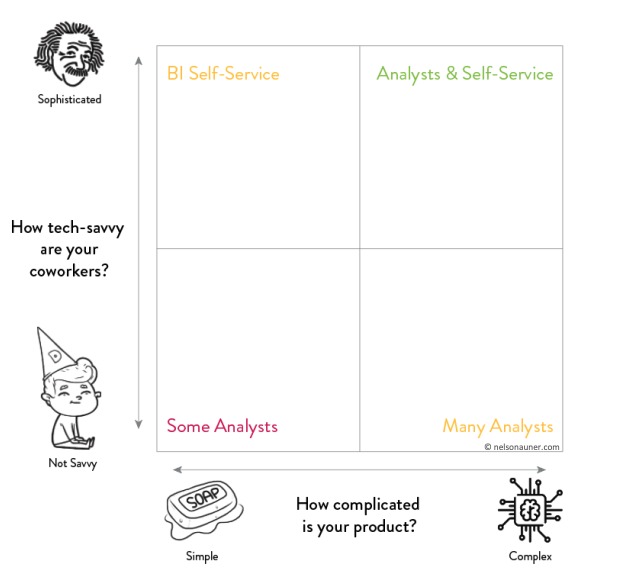
Here is a simple chart to help quickly triage possible analytics solutions from your particular situation:
This concludes the three main “courses” of an analytics stack. In this last section, I will touch briefly on the business logic layer, an increasingly necessary component of an analytics stack.
Business Logic Layer:
- You might consider: Looker, dbt
What is a “business logic layer”? Great question! If you are querying against copies of raw production tables, eventually different analysts will each use slightly different JOIN conditions and aggregations (COUNT vs COUNT(DISTINCT ..), and it will cause three types of problems. First, technically, the same expensive queries are getting run repeatedly. Second, financially, if you are paying per-compute, you are spending money for duplicated query work. Third, and most importantly, different teams will build out slightly different queries for the same metrics. Soon, you will end up spending more time trying to understand metric discrepencies than on improving them. Business logic layers solve this problem by centralizing, documenting, and version-controlling the (data <-> business metric) interface.
If you don’t use Looker, you should at least consider dbt. If you do use Looker, the gains to using dbt are less because LookML is also a way to centralize and version-control business logic. I opted to use dbt because of its advanced capabilities in testing, snapshotting data diffs, allowing for user defined functions, and because it allows us to use dbt’s cleaned data for data science instead of trapping that data in Looker. You can use dbt open source or their paid hosted version, dbt Cloud. dbt Cloud is more user friendly, but still requires a fair amount of technical knowledge to operate.
Org Discussion Points: Since dbt is either free (run yourself) or very cheap (dbt cloud), this is likely an easy talk. I regret setting up dbt on an EC2 box instead of going directly to dbt’s paid cloud offering, because I had to monitor the EC2 box’s status and manually deploy changes. Once we had multiple team members, coordinating deployments with other data coworkers on a single EC2 box was also overly complicated.
dbt is much more technical than looker, so your average business user is either going to need to level up their command line skills, or not be involved in the dbt process. Finally, dbt Cloud doesn’t offer automated user provisioning, so this will be yet-another-tool to admin. C’est la vie!